| |
SOLAR RADIATION AND CLIMATE
OF THE EARTH |
|
V.M.
Fedorov The study results for space and time variations of Earth’s solar climate in the modern era are given with respect to periodical disturbances of Earth’s orbital movement and rotational axis inclination as a result of precession and nutation. Based on calculations performed, peculiarities of time variability in solar radiation penetration (in the absence of atmosphere) to the Earth were determined, along with its spatial distribution on the Earth’s ellipsoid surface. It was determined that in the modern era (3000 B.C. to 2999 A.D.), the incoming solar radiation is reduced, which is related to secular change of its rotational axis inclination. The incoming radiation shows periodicity of 2, 3, 8, 11 and 19 years. Penetration of solar radiation into equatorial regions of the Earth in the modern era is being increased, and that to the polar regions – significantly reduced. Thus, the inter-latitude gradient of the solar radiation penetrating the Earth in the absence of atmosphere is increased. Within a secular trend, the solar radiation is reduced in summer hemispheres, and increased in winter hemispheres. The solar radiation annual change has a reverse direction in relation to secular variability. Solar radiation,
solar climate, modern era, disturbed motion, space and time variability,
periodicity, precession, nutation.
By using the calculation method, the values of solar radiation penetrating latitudinal zones of the Earth (5°) were obtained for 1/12 of the tropical year, astronomic seasons, six months and tropical years. Individual blocks of values are given in the Radiation Databases section. The analysis of solar radiation values obtained for the conditions in the absence of atmosphere in various geographical zones on the Earth’s ellipsoid surface for astronomic seasons, six months and tropical years will allow obtaining new results for space and time variations of the Earth’s solar climate.
Comparison of results The calculation results of solar radiation were compared with the data given in works of M. Milankovich and A.S. Monin (Milankovich, 1939; Monin, 1982), and with the values measured for latitudinal zones in climatology papers (Drozdov et al., 1989; Khromov, Petrosyanz, 2006). The comparison of M. Milankovich and A.S. Monin results with our values (Table 3) is given in Tables 1 – 3.
Table 1. Solar radiation coming to the atmosphere upper boundary, MJ/m2 (Milankovich, 1939).
The calculation results presented in Tables 1-3 show that in general, values of incoming solar radiation average for six months and year obtained by various authors are similar. Also, average values of solar radiation coming to the Earth during a day are similar. According to the data given by M. Milankovich, this value was 26.455 MJ/m2, according to Monin – 25.801 MJ/m2, according to our data – 25.953 MJ/m2. Proportions of average total values of incoming solar radiation in summer and six winter months are also similar.
Upon the results of M. Milankovich calculations, this proportion was 0.466 (as in this case, the energetic equivalency of hemispheres is assumed, the values referred to each of them). A.S. Monin results and our results are given in Table 4.
Table 4. Average values of solar radiation (MJ/m2) coming to the northern and southern hemisphere and their proportion.
Thus, a favorable agreement between the values calculated by M. Milankovich, A.S. Monin and our values of average incoming solar radiation is observed. Calculations made by A.S. Monin cover a more extended period (a million of years to the past and to the future), than ours, so it is possible that the data in Table 4 is somehow different. Furthermore, various primary data was used, and the increment in A.S. Monin calculations is 5,000 years, whereas in ours, it equals 1 day. Radiation values obtained by us for various latitudinal zones and astronomic seasons agree with the data given in climatology papers (Drozdov et al., 1989; Khromov, Petrosyanz, 2006). The agreement of average values of incoming radiation allows considering the calculation data to be correct for further analysis.
Long-term variations of solar radiation The long-term variation of incoming radiation shown in the chart (Fig. 1) against the background of general reduction contains interannual, 2-, 3-, 8-, 11- and 19-years variations (Fedorov, 2012, 2013, 2014).
Hence, we obtain 2
Thus, latitudinal contrasts in the modern era are increased. This effect may result in intensified transfer of meridian heat from the equatorial area to polar regions within general atmosphere circulation and changes in the Earth’s global climate. The reducing flux of solar radiation coming to the Earth ellipsoid for a tropical year tends to increase in the regions below 45° of each hemisphere geographic latitude, and to reduce above 45° at the entire interval under study. The reduction of radiation incoming to polar regions for the whole period reaches 1.58Е+08 J/m2, which amounts 2.8% relative to the average value (for the entire interval– 5999 years) of incoming radiation for latitudinal zones (85 – 90 degrees of geographic latitude). Increase in the equatorial region is significantly less and in the equator zone is 3.32Е+07 J/m2 (0.25%). This effect in space variability during tropical years is related to the secular trend of decreasing in earth rotational axis inclination (relative to the perpendicular line of the ecliptic plane) as a result of precession. It is known that when the inclination angle is increased, the radiation income to polar regions is also increased, e.g., the latitudinal contrast is smoothed and seasonal differences are intensified. When the inclination angle is decreased, radiation coming to subequatorial areas is increased, and latitudinal contrasts are increased, whereas seasonal contrasts are smoothed (Milankovich, 1939; Monin, Shishkov, 1979, 2000; Monin, 1982).
The variability in radiation coming to polar regions and the area located between polar circles, given in Fig. 3, is typical of the entire time interval under study (3000 B.C. – 2999 A.D.). The sign change in 19-years variability is localized in the latitudinal range of 35° - 65° of each hemisphere latitude. In hemispheres, during various cycle phases, the span of reduction and increase zones of solar radiation may significantly differ. The analysis of all calculated data shows that variations of the radiation coming to polar regions and the equatorial area are antiphased (if increased in polar regions, then decreased in equatorial areas, and vice versa). However, sometimes, the reduction of radiation for ten years is observed for latitudinal zones of Earth, for example, 1880 – 1889 and 1910 – 1919. For the 2000 – 2009 period, a 19-years cycle is applied, which is described by an increase of radiation coming to polar regions and its decrease in a vast area from 70° S to 65° N (Fig. 3, а). The current ten years period is related to the phase, which shows the reduction of incoming radiation in polar regions and its increase in the subequatorial area. In this case (Fig. 3 b), the polar area, which is described by reduced incoming radiation, is larger than in the southern hemisphere. The maximum increase of incoming radiation also shifted from the equator to the southern hemisphere. Thus, the current phase of the cycle shows spatial asymmetry in solar radiation coming to the Earth ellipsoid. The average amplitude of the 19-years variability in the southern polar area (85° – 90° S) is 0.00374% (2,06936Е+05 J/m2), in the northern area (85° – 90° N) – 0.00369% (2.04554Е+05 J/m2) of the average amount of radiation coming to respective latitudinal zones.
Average amplitude of 2- and 3-years variability related to commensuration in orbital movement of Earth, Mars and Venus (Fedorov, 2013) is 0.00147% (3.91016Е+06 J/m2) of radiation coming to Earth during a year, and it is increased in the equatorial area (5° – 5° S) to 0.00156% (2.05302Е+05 J/m2). The interannual variability related to the period of Earth movement around the Sun manifests itself in all latitudinal zones. Variability with a 19-years period is typical of polar areas. Variability with 2- and 3-years periodicity is localized in the latitudinal range between northern and southern polar circles. In the same area, with average amplitude components being 0.00184% (6.27115Е+06 J/m2) of incoming radiation, 8- and 11-years periodicity is observed, which is a result of superposition of 19-years and 2- and 3-years periodicities. The 2- and 3-years periodicity forms 8- (2+3+3) and 11-years (2+3+3+3) combinations synchronized with 8- and 11-years phases of the summer cycle. Thus, 8- and 11-years summer cycles result from synchronization and superposition of 19-years summer and 2- and 3-years summer variations. In the equatorial area (5° N – 5° S), the average amplitude of 8- and 11-years periodicity is increased to 0.002% (2.64490Е+05 J/m2). The pattern of modern and spatial changes of incoming solar radiation can be embodied in radiation and heat conditions of the planet. For example, in the spectral analysis of study results of isotopic and oxygen composition of ice core in the Antarctic, a predominant peak is found within 19 years (Vladimorova, Yekaykin, 2014). The effect of antiphase changes of solar radiation coming to polar and equatorial regions in a 19-years cycle can be observed in circulation processes in the atmosphere as a mechanism participating in regulating the intensity of meridian transfer of air masses. The regularity of 2, 3 years and 8, 11 and 19 years can manifest itself in biosphere processes as well.
Secular variation of solar radiation Secular variability of incoming solar radiation was calculated by deducting the income solar radiation values in 3000 B.C. from respective (in time and space) values of solar radiation in 2999 A.D. (Fig. 5, Table 5).
The analysis of the results obtained (Fig. 5, Table 5) shows the following features of the secular trend of changes in incoming solar radiation. 1). During the six winter months for hemisphere, the income of solar radiation is increased, and during the six summer months it is decreased (seasonal differences are smoothed). Analysis of changes in incoming radiation within the considered interval upon hemispheres and six month periods shows that during the six summer months for hemispheres, the reduction is 1.19Е+09 J/m2, and during the six winter months, the increase is 6.10Е+08 J/m2 2). During the six winter months for hemispheres, the most significant increase is observed in the 3rd month (in its last 1/3) of the autumn season and the 1st month of the winter season in each hemisphere. Maximum increase of incoming radiation is observed within the latitudinal range between 25 and 50 degrees of latitude in each hemisphere. 3). During the six summer months for hemispheres, the most significant reduction occurs in the 2nd and 3rd months of the spring seasons, and 1st and 2nd seasons in each hemisphere. The reduction during these seasons is sequentially increased with latitude increase. 4). Dead zones are found – polar regions that do not receive solar radiation in individual season during the entire interval (5999 years). During the 2nd and 3rd autumn months and two first winter months (two first thirds of the seasons), latitudinal zones within 80 - 90 degrees of latitude in each hemisphere receive no solar radiation at all. In the last third of autumn and first third of winter, the income of solar radiation equals zero within the range of 70 - 80 degrees of latitude in each hemisphere. 5). The subequatorial zone within 5 deg. S - 5 deg. N. exists, which is typical of incoming radiation increase within the studied interval during the entire year. This area expands to 10 degrees of latitude in 2nd and 3rd month of spring and first two thirds of summer for each hemisphere, and to 15 degrees of latitude in the last third of the spring seasons and first third of the summer seasons in each hemisphere. The secular trend in solar radiation income is described by maximum reduction during periods related to solstices and minimal reduction in periods related to equinoxes (Fig. 6). Annual income of solar radiation has a reverse direction in relation to the annual course of yearly variability of solar radiation reduction (Fig. 7), e.g., at the studied interval, the secular variability of incoming radiation (3000 B.C. – 2999 A.D.) and radiation coming during a year are antiphased.
The antiphased distribution described above manifests itself in the fact that in summer hemispheres, the incoming radiation is reduced, and in winter hemispheres, it is increased. In the annual income, the maximum values are observed in summer hemispheres, and minimal values – in winter hemispheres. Secondly, maximum reductions of secular variability occur on equinoxes, and minimal ones – on solstices. In the annual income of radiation, equinoxes show maximum income of radiation, and solstices – minimal income. This testifies smoothed differences in providing solar radiation between six months. This conclusion is proved by comparison of Fig. 5, Table 5 and Fig. 8, Table 6.
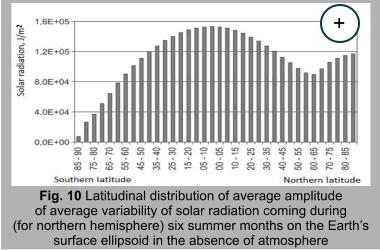
Interannual variability of solar radiation Peculiarities of interannual variability of solar radiation coming to Earth for a year (Fig. 4, table 7) and six months periods (Fig. 9, 10, 11) during 3000 B.C. - 2999 A.D. were studied separately. During the six summer months (for the southern hemisphere), the average amplitude of interannual variability is 0.00342% in relation to the total variability for six months (absolute values of interannual variability amplitude are given in charts). For the northern hemisphere, this value is 0.00155%. In 2- and 3-years cycles, the interannual variability amplitude of incoming solar radiation is increased to 0.00399% in the southern hemisphere and to 0.00198% – in the northern one. In 8-, 11- and 19-years cycles, the interannual variability amplitude reaches its maximum values – 0.00486% in the southern hemisphere and 0.0024% – in the northern hemisphere. In the southern polar area (85 – 90 degrees of southern latitude), the average value of interannual variability during this period is 0.04338%. In 2- and 3-years cycles, it is increased to 0.05381%; in 8- and 11-years cycles - to 0.06779%. In the northern polar area (85 – 90 degrees of northern latitude), during the six summer months, the average value of interannual variability is 0.00211. The variability is observed only for the 19-years cycle, which average amplitude is 0.0037%.
During the six winter months (for northern hemisphere) the interannual variability is significantly less than during the six summer months. In the southern hemisphere, the average value of interannual variability is 0.0008% (0.00169% during 19-years six months). In the northern hemisphere, the average amplitude of interannual variability is somewhat higher – 0.00134%. Interannual variability amplitude in the southern polar area during this period is 0.00213% (0.00376 during 19-years six months). The average value of interannual variability in the northern polar area is 0.04286%, 0.05359% in 2- and 3-years cycles, 0.06781% - in 8- and 11-years cycles. Thus, maximum amplitudes of interannual variability during the six summer months (for the northern hemisphere) are typical of the southern polar area (where its 2-, 3-, 8- and 11-years variations are observed). In the northern polar area, the interannual variability is marked by 19-years periodicity. During the six winter months (for the northern hemisphere), maximum values are typical for the Northern polar area where they are described by variations with periods of 2, 3, 8 and 11 years. In the southern polar area, the interannual variability is regulated by a 19-years cycle. During the six winter months for the hemispheres, average amplitudes of interannual variability are less than those for summer months.
Conclusion The analysis of calculation results for incoming solar radiation in the absence of atmosphere allows to make the following conclusions: 1. In the modern era (3000 B.C. - 2999 A.D.), the solar radiation coming to Earth is reduced. The radiation decrease is related to secular change of the Earth’s rotational axis inclination. The solar radiation coming to the Earth shows interannual variability and periodicity of 2, 3, 8, 11 and 19 years. In polar regions, 19-years periodicity prevails. In equatorial regions, maximum amplitudes are marked for 2- and 3-years periodicity. 2- and 3-years periodicity form 8- and 11-years cycles (2+3+3 and 2+3+3+3) that in total compose a 19-years cycle. The periodicity obtained is determined by superposition and synchronization of the nutation cycle and disturbances related to commensuration in Earth, Mars and Venus orbital movements. 2. The income of solar radiation to equatorial areas of the Earth in the modern era are somewhat increased, whereas they are decreased in polar regions. Thus, the inter-latitude gradient of solar radiation coming to the Earth ellipsoid in the absence of atmosphere is increased (latitudinal contrasts are increased). 3. For a nutational 19-years cycle, the interchange of increase and decrease of incoming solar radiation in equatorial and polar regions are observed for various phases of the cycle that approximately equal to half of the period. This effect is related to the Earth’s rotational axis inclination as a result of nutation. 4. Within a secular trend in summer hemispheres, the incoming radiation is reduced, whereas in winter hemispheres it is increased (seasonal differences are smoothed). Maximum reductions of secular variability occur on equinoxes, and minimal ones – on solstices. Within a annual income of radiation, the maximum reduction of radiation occurs on equinoxes, and the minimal one – on solstices. 5. Maximum absolute values of interannual variability amplitude of solar radiation are observed in the equatorial and polar regions. Minimal values are typical of latitudinal areas 60° – 65° in each hemisphere. 6. During the six summer months for the northern hemisphere, maximum amplitudes (upon absolute values) of interannual variability are typical of the equatorial area, and minimal ones – for 60° – 65° N. During the six winter months for the northern hemisphere, maximum amplitudes of interannual variability are observed in the southern polar area, and minimal ones – in the northern polar area and within 25° – 30° N. These features of solar radiation income and its distribution upon the Earth’s ellipsoid surface can be important in studying changes of the Earth’s global climate, atmosphere and World Ocean, Earth’s cryosphere and biosphere condition and dynamics.
|
||||||||||||||||||||||||||||||||||||||||||||||||||||||||||||||||||||||||||||||||||||||||||||||||||||||||||||
 Similar reduction is typical of the whole period from 3000 B.C. to 2999
A.D. The interannual variability is related to periodical disturbances
of the Earth's orbital movement by the Moon, the Solar System planets
and changes in the axis rotation inclination. The 2 and 3-year variability
is explained by disturbances of the Earth's orbital movement by Mars
and Venus. It is known that the movement parameters of plants and their
satellites have a number of proportions caused by commensurations and
orbital resonances (Grebenikov, Ryabov, 1978).
The resonance conditions are defined by equal frequencies of forced
(by external forces) and own oscillations. The Venus siderial period
is 224.701 days (0.61521 tropical years), that of Mars is 686.980 days
(1.88089 tropical years), Earth's (siderial year) is 365.526 days (1.00004
tropical years). Planetary circulation frequencies
Similar reduction is typical of the whole period from 3000 B.C. to 2999
A.D. The interannual variability is related to periodical disturbances
of the Earth's orbital movement by the Moon, the Solar System planets
and changes in the axis rotation inclination. The 2 and 3-year variability
is explained by disturbances of the Earth's orbital movement by Mars
and Venus. It is known that the movement parameters of plants and their
satellites have a number of proportions caused by commensurations and
orbital resonances (Grebenikov, Ryabov, 1978).
The resonance conditions are defined by equal frequencies of forced
(by external forces) and own oscillations. The Venus siderial period
is 224.701 days (0.61521 tropical years), that of Mars is 686.980 days
(1.88089 tropical years), Earth's (siderial year) is 365.526 days (1.00004
tropical years). Planetary circulation frequencies  The calculation results allowed determining peculiarities expressed
against general reduction of incoming radiation and related to secular
and 19-years variability in radiation income. The secular variability
was assessed by a difference of incoming radiation values (J/m2)
during the last (2999 A.D.) and the first year (3000 B.C.) of the time
interval for respective latitudinal zones. The calculation results show
that with general reduction of incoming radiation, a trend for significant
reduction is marked in polar regions, and for somewhat increase in equatorial
areas (Fig. 2).
The calculation results allowed determining peculiarities expressed
against general reduction of incoming radiation and related to secular
and 19-years variability in radiation income. The secular variability
was assessed by a difference of incoming radiation values (J/m2)
during the last (2999 A.D.) and the first year (3000 B.C.) of the time
interval for respective latitudinal zones. The calculation results show
that with general reduction of incoming radiation, a trend for significant
reduction is marked in polar regions, and for somewhat increase in equatorial
areas (Fig. 2). Against the background of this effect in secular variability of incoming
radiation, 19-years variations are expressed, that only complicate the
latter (Borisenkov et al., 1983, 1985; Fedorov,
2012, 2013; Fedorov, 2012). When determining the space structure
of the 19-years variation, to simplify calculations, differences of
incoming radiation were studied for the 10th and 1st
year of the decades from 1850 to 2019. As previous studies have shown
actual phases of the 19-years cycle are described by duration of 8 and
11 years (Fedorov, 2013, 2014). The results
obtained show regular changes in the spatial structure of incoming radiation
in various phases of the 19-years cycle. For one half of the cycle,
reduction of incoming radiation to polar regions is typical, along with
its increase in the equatorial area. The other half of the cycle is
opposite – the incoming radiation is reduced in the equatorial area
and is increased in polar regions (Fig. 3). One phase of the 19-years
cycle intensifies the trend typical of the secular variability, and
the other phase attenuates it.
Against the background of this effect in secular variability of incoming
radiation, 19-years variations are expressed, that only complicate the
latter (Borisenkov et al., 1983, 1985; Fedorov,
2012, 2013; Fedorov, 2012). When determining the space structure
of the 19-years variation, to simplify calculations, differences of
incoming radiation were studied for the 10th and 1st
year of the decades from 1850 to 2019. As previous studies have shown
actual phases of the 19-years cycle are described by duration of 8 and
11 years (Fedorov, 2013, 2014). The results
obtained show regular changes in the spatial structure of incoming radiation
in various phases of the 19-years cycle. For one half of the cycle,
reduction of incoming radiation to polar regions is typical, along with
its increase in the equatorial area. The other half of the cycle is
opposite – the incoming radiation is reduced in the equatorial area
and is increased in polar regions (Fig. 3). One phase of the 19-years
cycle intensifies the trend typical of the secular variability, and
the other phase attenuates it.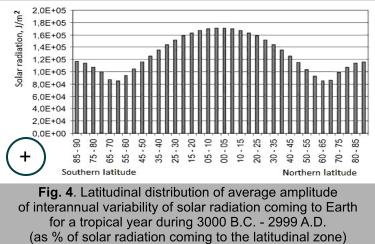 Thus, the spatial structure of the 19-years variation shows an effect
expressed in consequential change of the sign of incoming radiation
from one cycle phase to another in polar regions and the equatorial
area. This effect is related to nutational change of the rotational
axis inclination with a period of about 19 years, and its physical nature
is similar to the effect typical of secular variability and related
to precession: the incoming radiation is increased with smaller inclination
angle in the equatorial area, and it is reduced in polar regions. When
the inclination angle is increased, a reverse situation occurs.
Thus, the spatial structure of the 19-years variation shows an effect
expressed in consequential change of the sign of incoming radiation
from one cycle phase to another in polar regions and the equatorial
area. This effect is related to nutational change of the rotational
axis inclination with a period of about 19 years, and its physical nature
is similar to the effect typical of secular variability and related
to precession: the incoming radiation is increased with smaller inclination
angle in the equatorial area, and it is reduced in polar regions. When
the inclination angle is increased, a reverse situation occurs.

|
SOLAR RADIATION AND CLIMATE |
|
|||||
|
© www.solar-climate.com
|

|
|
||||||||||||||||||||||||||||||||||||||||||
|
|
|||
|
|||||||||||||


 |
 |