| |
SOLAR RADIATION AND CLIMATE
OF THE EARTH |
|
V.
M. Fedorov The relationship has been identified between the incoming solar radiation and anomalies of the sea surface temperature (SST) for the Earth and hemispheres at the present time. The enhancing effect of the inter-latitude heat transfer in the ocean surface layer was found. This is related to the decreasing of incoming solar radiation in Polar and the increasing in the Equatorial regions of the Earth. The enhancing effect of the inter-latitude heat transfer associated with secular variations of the Earth`s axis inclination.
Introduction The study of reasons for global sea surface temperature (SST) changes is relevant to understand heat exchange processes in the ocean-atmosphere, ocean-continent systems and their roles in the Earth global climate changes (Budyko, 1974; Monin, Shishkov, 1979; Monin, 1982; Hrgian, 1986; Drozdov et al., 1989). It is no doubt that solar radiation is extremely significant in the formation of the sea surface layer thermal conditions. “However diverse are periodic movements occurring in the sea waters, their reasons are usually the same—the Sun radiation energy” (Shuleikin, 1953). In this connection, this paper studies trends and changes for SST changes associated with solar radiation coming to the atmosphere upper boundary (sun activity change is not considered).
Results and their discussions Based on astronomical ephemerises DE-406, solar radiation coming to Earth ellipsoid (or the atmosphere’s upper boundary) from 1850 A.D. to 2050 A.D. was calculated (Fedorov, 2015 a, b). Variations related to Sun activity change were not considered. In the result of calculations, a radiation database was generated (http://www.solar-climate.com/en/ensc/bazard.htm). Calculated values of incoming solar radiations were combined with SST anomaly dataset (http://www.cru.uea.ac.uk/cru/data/temperature). It is known that solar radiation coming to the Earth surface, including the ocean surface, is transformed into thermal energy and redistributed towards the equatorial area (heat source) to polar regions (heat outlets). Such redistribution results in smoothening of latitudinal temperature differences in the meridian direction (Monin, Shishkov, 1979; Monin, 1982). This heat exchange mechanism is known as the “first type thermal machine” (Shuleikin, 1953). Within the annual course, it is more intensively expressed in the winter six months in hemispheres due to large values of the inter-latitude temperature gradient both in the atmosphere and the ocean surface layer.
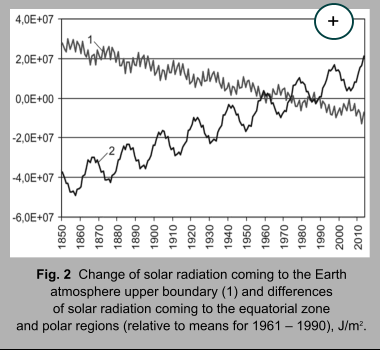
Thus, latitudinal contrasts in the Earth solar climate increase. A consequence of this effect can be intensified by meridian heat transfer from the equatorial area to polar regions and respective changes of thermal characteristics of both sea surface layer and the Earth global climate. The reduction of radiation coming to polar regions from 1850 to 2050 was determined upon 5.79Е+06 J/m2, which is 0.11% relative to the medium (from 1850 to 2050) value of incoming radiation for latitudinal zones (85° – 90° latitude). Increase in the equatorial zone is significantly smaller: in the equator zone (0° – 5° latitude), it equals 9.15Е+05 J/m2 (0.007%). Increase of difference of incoming radiation in these zones in 2050 will be 6.70Е+06 J/m2, which is by 0.09% higher than in 1850. This effects in spatial variability of solar radiation coming to the Earth ellipsoid (without respect to atmosphere) is associated with a secular trend to decrease the Earth axis inclination (relative to the perpendicular to the ecliptic plane). It is known that with the axis inclination angle increase, the solar radiation coming to polar regions is also increased, e.g., the latitudinal contrast of solar temperatures in hemispheres is smoothed and seasonal differences are increased. With the axis inclination angle decrease, the solar radiation coming to polar regions is decreased. Latitudinal contrasts are increased, and seasonal ones are smoothed (Monin, Shishkov, 1979; Monin, 1982; Monin, Shishkov, 2000). The calculated solar radiation coming during a tropical year (Fedorov, 2013) to the Earth (with no respect to atmosphere) and individual hemisphere was compared with SST anomaly dataset represented in the HadSST3 archive of the University of East Anglia in conjunction with the Hadley Center (http://www.cru.uea.ac.uk/cru/data/temperature). Furthermore, SST anomalies were compared with the difference of solar radiation coming to latitudinal zone 45° N to 45° S and radiation coming to the areas from latitude 45° to 90° (totally for hemispheres) for the Earth (Fig. 2). For hemispheres, this difference was determined between solar radiation of latitudinal zones 0° – 45° and 45° – 90° of each hemisphere. Comparison of calculated and radiation data and data given in temperature data archives (http://www.cru.uea.ac.uk/cru/data/temperature) shows as follows. The solar radiation coming to the Earth (and individual hemispheres) is reduced (Fig. 2). The anomaly value of the solar radiation coming to the Earth surface (in respect to the mean for 1961 – 1990) from 1850 to 2013 is 3.49Е+07 J/m2. The difference of solar radiation coming to the equatorial zone and polar regions of the Earth (and hemispheres) is increased for this period by 5.83Е+07 J/m2 (relative to the mean for 1961 – 1990). The SST temperature on the Earth and individual hemispheres is increased. The SST anomaly (relative to the mean for 1961 – 1990) from 1850 to 2013 is 0.691°С. For the northern hemisphere, the reduction of incoming radiation is 1.73Е+07 J/m2, difference anomalies—2.91 J/m2. The SST anomaly is marked by 0.697°С. For the southern hemisphere, the anomaly of incoming solar radiation is 1.76Е+07 J/m2, the difference anomaly is 2.92Е+07 J/m2. The SST anomaly in the southern hemisphere for the period is 0.704°.
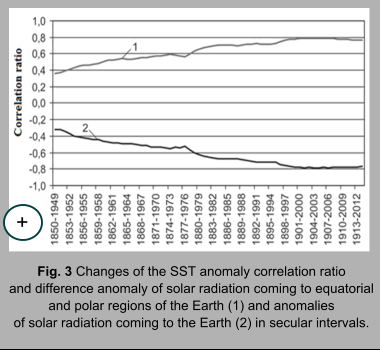
Study of a link between the temperature dataset and solar radiation values was conducted on the basis of correlation analysis. The correlation link was studied upon rows with constant duration of 100 years (secular interval) with consecutive shift (1-year pitch) from the start of actual data array (1850) to its end (2013). Thus, the correlation ratio (R) values for 1850 – 1949, 1851–1950, etc., for all 66 secular intervals were determined (Fig. 3). R values with SST anomaly values and solar radiation (incoming radiation and difference) values are described by high correlation link with average value for respective secular intervals (given in the HadSST3 dataset). Average R values are 0.985 to 0.979 for incoming radiation and difference, respectively. Indicator of meteodata is a percentage share of the sea covered by five degree cells with meteodata relative to the whole surface of the World Ocean. Changes of R values (Fig. 3) upon secular intervals reflect an irregular nature of meteodata distribution in the HadSST3 dataset upon credibility. The dataset shows secular (close to modern times) from 1900 to 1999, etc., to 1914 – 2013, (totally 15 intervals), where R values become high and rather close (Table 1). Table 1 Average values
of the OSL temperature anomaly and incoming solar radiation (probability
= 0.99).
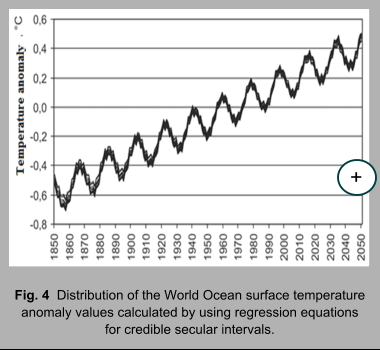
R changes within 15 secular intervals are 0.54% (incoming radiation) for the sea surface temperature and 1.03% (difference), for northern hemisphere SST—1.20% and 1.12%, for southern hemisphere SST—0.27% and 0.62%. These secular intervals correspond to most credible data from the HadSST3 dataset (http://www.cru.uea.ac.uk/cru/data/temperature). In terms of meteodata credibility criteria, high and stable R values reflecting the actual and credible link between the SST anomaly and solar radiation anomaly in the atmosphere upper boundary (incoming and difference), data for these secular intervals are taken as a basis for building linear regression equations. Negative correlation link of the SST anomaly and solar radiation coming to the Earth and positive link with the difference of solar radiation coming to the equatorial and polar region are found (Table 1). The southern hemisphere SST shows closer correlation link of the temperature anomaly with the solar radiation than the northern hemisphere (Table 1). This can be explained by dispersion introduced in the SST anomaly by the heat exchange mechanism related to various seasonal heating and cooling of continents and oceans (known as the “first type thermal machine,” Shuleikin, 1953). Based on regression equations (the HadSST3 dataset was used) obtained for credible secular intervals, the values of SST anomaly for 1990 to 2050 were calculated for the sea surface temperature and SST of hemispheres (Fig. 4). The distributions obtained reflect secular trends of the SST anomaly changes defined by the combination of periodic change of the Earth axis inclination angle (about 40,000 years), precession (about 25,700 years) and nutation (19-year) cycles regulating the income of solar radiation on the atmosphere upper boundary (Fedorov, 2012, 2013, 2014).
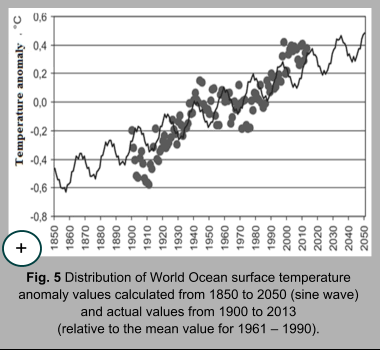
Detailed comparison of calculated values of the SST anomaly with actual values was made for the period of credible data from 1900 to 2013 (Fig. 5). The average discrepancy in modulus for this period is 0.117°С, (59.7% of the annual average modulus of the actual anomaly equal to 0.197°С). The analysis shows that 90% of actual values of the anomaly lies within ± 0.232°С from the anomaly’s calculated values. The modulus-average discrepancy of anomaly actual values from the values calculated for the northern hemisphere SST is 0.141°С (72.1% of the annual average modulus of the anomaly equal to 0.195°С). The interval that contains 90% of SST actual anomaly is limited by the range of ±0.268°С. In the southern hemisphere SST the discrepancy is 0.110°С (49.0%). The annual average modulus of the actual anomaly from 1900 to 2013 is 0.225°С. The interval containing 90% of the actual anomaly values is limited by ± 0.227°С. The annual average of the SST anomaly in the southern hemisphere (0.225°С) for 1900 to 2013 in modulus exceeds the respective value obtained for the northern hemisphere SST (0.195°С), e.g., the southern hemisphere SST is increased more intensively than in the northern hemisphere. Smaller values of discrepancy between actual and calculated values obtained for the southern hemisphere SST denote that the SST anomaly increase is defined by the inter-latitude heat exchange mechanism to a greater degree than in the northern hemisphere. Upon the sign, the actual values of the temperature anomaly have high coincidence with calculated values (both rows are represented relative to the average temperature for 1961 – 1990). For the World Ocean, for 1900 to 2013, the coincidence is 85.1% (97 years), for the northern hemisphere SST—74.6% (85 years), for the southern hemisphere—81.6% (93 out of 114 years).
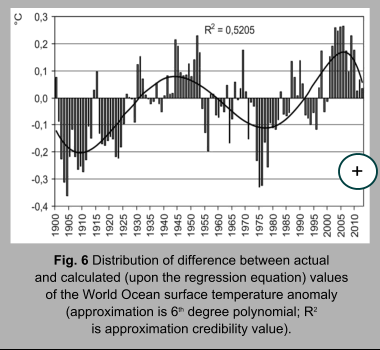
Discrepancy values given in Fig. 6 show that there are groups of actual anomaly values (with average duration 28-29 for the World Ocean) located either above or below the anomaly values. Averagely for the World Ocean, in each group, 79.8% of actual values lie either above or below the calculated values. Depending on this, they are conditionally defined by us as warm and cold ones, respectively. For the World Ocean, from 1900 to 2013, four such groups are distinguished (epochs): 1900 – 1925 – cold, 1926 – 1953 – warm, 1954 – 1986 – cold, 1987 – 2013 - warm. Similar groups are distinguished for SST hemispheres as well. In the northern hemisphere SST, the regularity (upon the “above- or below calculated values” criteria) of values in groups is averagely 79.4%. In chronological terms, these groups are synchronized with circulation epochs distinguished in the typification of atmospheric processes for the northern hemisphere (Kononova, 2009). They are also similar to intervals in the ocean-atmosphere system (Anisimov et al., 2012). The regularity of groups in the southern hemisphere SST is 80.9%. It is possible that the variations revealed are defined by periodicity of heat exchange processes in the ocean-continent system (with a period close to 56-58 years). Table 2 Comparison of
actual and calculated values of SST anomalies
Modulus-average values of discrepancy for warm and cold epochs for the World Ocean are 0.099 °С and 0.135°С, for the northern hemisphere SST—0.115°С and 0.165°С, for the southern hemisphere—0.095 °С and 0.126 °С, respectively. With respect to average discrepancy values obtained for the epochs, discrepancies of calculated and actual values (modulus-average) for the World Ocean are reduced to 0.092°С (46.9% of the average actual anomaly modulus), which is by 12.8% less than with no respect to correction. In the northern hemisphere SST, the average discrepancy in modulus with respect to corrections is 0.104°С (53.3%, e.g., by 18.8% less than with no corrections). In the southern hemisphere SST, the average discrepancy in modulus is 0.093°С (41.4%, e.g., by 7.6% less than with no corrections). Coincidence in sign of actual and calculated anomaly values (represented relative to the average for 1961 – 1990) is also changed: for the World Ocean, from year 97 to 94 (from 85.1 to 82.5%), in the northern hemisphere—from 85 to 91 (from 74.6 to 79.8%), in the southern hemisphere SST—from 93 to 101 (from 81.6 to 88.6%). R values between actual and calculated values of the anomaly are increased (Table 2). With respect to corrections, confidence interval seem to contract (for 90% credibility) by 25.0%, 19.0% and 22.5% from the initial value (with no corrections) for the World Ocean, northern hemisphere and southern hemisphere, respectively. The link between the annual incoming solar radiation (accumulation calculated by summing annual values of incoming radiation from 1850 to 2050) and the SST anomaly was studied. The studies showed the increase of correlation ratio values for the accumulated solar radiation and the SST anomaly and the decrease of discrepancy values of calculated and actual values of SST anomalies. Thus, R values of incoming solar radiation and the sea surface temperature anomalies are negative and equal -0.756, for the northern hemisphere -0.657, for southern hemisphere -0.784 (for rows from 1850 to 2013). In case of accumulated solar radiation, R values are described by positive values equal to 0.796, 0.687 and 0.823, respectively. R values of accumulated solar radiation and SST anomalies exceed the R values obtained to assess the link of solar radiation (with no respect to accumulations) and the anomaly by 5.3% for the World Ocean, by 4.6% for the northern hemisphere and by 5.0% for the southern hemisphere. R values for calculated (with no respect to accumulated radiation) values of SST anomaly with actual values are 0.756 for the World Ocean, 0.657 for the northern hemisphere, 0.784 for the southern hemisphere. R values for anomalies calculated with respect to accumulation of solar radiation upon the linear regression equations are 0.796, 0.687 and 0.823, respectively. The increase of the correlation ration values for the World Ocean is 5.3%, for the northern hemisphere—4.6%, for the southern hemisphere—5.0%. Discrepancy of actual and calculated (upon the linear regression equation) values of the SST anomalies in case of incoming solar radiation of the World Ocean is (with no respect to corrections for warm and cold epochs) 56.1% from the annual average value modules for the actual SST anomaly, 72.3% for the northern hemisphere, 47.9% for the southern hemisphere. For calculated values of the SST anomaly with respect to accumulation of incoming solar radiation, discrepancy values are reduced and become equal 52.3%, 71.5% and 44.1%, respectively. Thus, the discrepancy of actual and calculated values is reduced for the World Ocean by 6.8%, by 1.1% for the northern hemisphere, by 7.7% for the southern hemisphere. Calculated anomaly values of annual and seasonal SST are represented as tables on various pages of this section.
Conclusion The modern era is distinguished by the effect of intensified inter-latitude heat exchange (“first type thermal machine”) in the World Ocean surface layer, associated with reduced income of solar radiation (with no respect to atmosphere) into polar regions and increased income of solar radiation (with no respect to atmosphere) into the Earth equatorial zone (increase of inter-latitude gradient in the distribution of incoming radiation). In the southern hemisphere SST, the intensification of inter-latitude heat exchange mechanism is more intensively expressed than in the northern hemisphere SST. The inter-latitude heat exchange intensification is related to secular change of the Earth axis inclination. Close relationships between the World Ocean surface temperature anomaly and incoming solar radiation were revealed. The change of the temperature anomaly and difference of solar radiation coming to the equatorial zone and polar regions have close positive ties as well, which proves that the intensification of inter-latitude heat exchange participates in secular trends of the SST anomalies. With respect to accumulation of incoming solar radiation, higher R values were obtained, along with small values of discrepancy between actual SST anomaly values and calculated SST anomaly values. The values of the correlation ratio between the solar radiation accumulated and the SST anomaly exceed R values obtained for the connection of the solar radiation with no respect to accumulation and SST anomaly by 5.3% for the World Ocean, by 4.6% for the northern hemisphere and 5.0% for the southern hemisphere. The discrepancy of SST anomaly values calculated with respect to accumulation of solar radiation with actual values is decreased by 6.8% for the World Ocean, by 1.1% for the northern hemisphere, by 7.7% for the southern hemisphere. The results obtained give evidence to intensified greenhouse effect and its impact on the formation of secular trends of the SST anomaly changes. Thus, two factors were defined that are related to space and time variations of solar radiation coming to the atmosphere upper boundary and defining sea surface temperature changes. The first factor is intensification of inter-latitude heat exchange. The second is intensification of natural greenhouse effect possibly related to the increased content of water vapor in the atmosphere due to increased evaporation caused by coming warm air masses, which is a result of intensified inter-latitude heat exchange and condensation.
|
||||||||||||||||||||||||||||||||||||||||||||||||||||||||
|
SOLAR RADIATION AND CLIMATE |
||
|
© www.solar-climate.com
|
|
|
||||||||||||||||||||||||||||||||||||||||||
|
|
|||
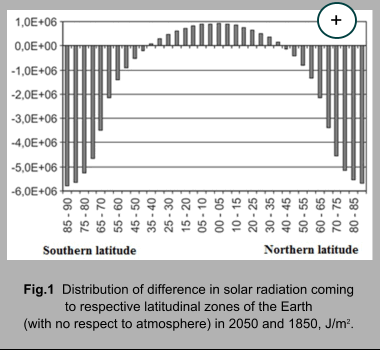 The calculations of incoming solar radiation allowed determining latitudinal
peculiarities expressed against its overall reduction and reflection
of the 19-year summer variability (Fedorov, 2012,
2013). Secular variability was assessed by the differences of
incoming radiation values (J/m2) in the last (2050) and first
(1850) year of this period for respective latitudinal zones. The calculation
results show that against the overall trend of decrease of solar radiation
coming to Earth, the polar regions of the Earth (above 45° latitude)
show a trend of substantial reduction, whereas the equatorial area (below
45° latitude) of some increase in incoming radiation (Fig. 1)
 The modulus average discrepancy between actual anomaly values and calculated
values of the northern hemisphere (0.141°С) exceeds the average discrepancy
obtained for the southern hemisphere SST (0.110°С). This is an evidence
of the fact that in the southern (more oceanic) hemisphere, the increase
of SST anomaly values is to a higher degree defined by the inter-latitude
heat exchange mechanism than in the northern (more continental) hemisphere.
The heat exchange mechanism related to various seasonal overheating
and cooling of continents and oceans is expressed in the northern hemisphere
SST, where it defines higher dispersions and discrepancy of actual values
of SST anomaly and calculated values, and where the inter-latitude heat
exchange is reduced. This is proved by lower (in modules) annual average
values of the SST anomalies in the northern hemisphere and R values
(Table 1).


